تثبيت التطبيق
How to install the app on iOS
Follow along with the video below to see how to install our site as a web app on your home screen.
ملاحظة: This feature may not be available in some browsers.
أنت تستخدم أحد المتصفحات القديمة. قد لا يتم عرض هذا الموقع أو المواقع الأخرى بشكل صحيح.
يجب عليك ترقية متصفحك أو استخدام أحد المتصفحات البديلة.
يجب عليك ترقية متصفحك أو استخدام أحد المتصفحات البديلة.
شرح برنامج Origin المتخصص برسم وتحليل ومعالجة البيانات المختلفة
- بادئ الموضوع علاء*
- تاريخ البدء
لغرض تثبيت هذه النسخة على الجهاز
اتبع الاتي
Install instructions
====================
1. Install OriginPro using the main installer.
2. Use this serial number when asked:
GF3S4-9089-7991320
3. Replace the original file with the included cracked one.
4. Copy the license file (orglab.lic) to the license folders:
Windows XP: \Documents and Settings\All Users\Application Data\OriginLab\86\License\
Win7/Vista: \ProgramData\OriginLab\86\License\
If the folders do not exist on your system, just create them.
Alternatively, you can run the included batch license setup.
5. Start OriginPro and use this RegistrationID to register it:
GRM-RVR-AR2
Scientist4ever
Active Member
جزاك الله خير
النسخة المحمولة لنفس البرنامج
OriginLab OriginPro 8.6 Portable

OriginLab OriginPro 8.6 Portable | 168.0 MB
OriginLab produces professional data analysis and graphing software for scientists and engineers. Our products are designed to be easy-to-use, yet have the power and versatility to provide for the most demanding user.Origin is an easy-to-use software application that provides powerful data analysis and publication-quality graphing capabilities tailored to the needs of scientists and engineers. Origin offers unique peak-analysis and curve-fitting capabilities, over 60 customizable graph types, and analysis templates, all within a tightly integrated workbook environment.
OriginPro offers all of the features of Origin plus extended analysis tools for statistics, including several nonparametric tests and repeated-measures ANOVA, peak-fitting and 3D surface fitting, image processing, and signal processing.
Gadgets
Gadgets provide a quick and easy way to perform exploratory analysis using a region of interest (ROI). Gadgets introduced in this version are Quick Fit, Statistics, Integration, FFT, and Rise Time. The Quick Fit gadget allows you to launch the advanced NLFit tool using the same function and parameter values, offering more control of the fitting process.
Batch Processing
The Batch Processing tool extends the power of Analysis Templates by allowing users to process multiple files or datasets. Users need only to process one file to create an Analysis Template with custom import settings, desired analysis results, and a worksheet that specifies which analysis result parameters to select for reporting. The tool then allows a user to select multiple disk files, or multiple datasets in the project, and performs batch analysis on them. In the end, a report sheet that consolidates the user-specified analysis results is generated from each file or dataset. Multiple files or datsets can also be repeatedly imported into an existing workbook window containing custom analysis settings and a Summary Report sheet.
Batch Peak Analysis (Pro)
This feature allows OriginPro users to perfom peak fitting of one dataset, save their custom settings as a Theme file, and then perform batch peak analysis of multiple selected datasets in the project using the custom theme. A summary report sheet will be created that lists the dataset name and results from the peak analysis such as peak integration results, or multiple peak properties, depending on the Peak Analyzer goal saved in the theme.
Slide Show of Graphs
You can now view all graphs in your project, or in a particular subfolder, in a full-screen slide show. The slide show can be customized to play in a loop or end when last graph is displayed. Custom key entries can be used during the slide show including options to turn off speed mode if present, or go to the currently displayed graph window. The order of the slides can be set using a newly introduced slide order column in Project Explorer.
This feature combined with the Favorites Folder feature allows for user to easily collect together all desired graphs in a project for viewing or for presenting to colleagues.
Favorites Folder and Project Explorer Shortcuts
Shortcuts to any Origin Window type such as graph, worksheet, or matrix can be added to any folder in Project Explorer. A Favorites folder has also been introduced, allowing user to right click on any window to quickly add shortcut to Favorites folder. This allows for easy organization of key windows and graphs in your Origin Project, and can then be combined with the Slide Show feature to create custom presentations.
Export Graphs to PowerPoint
In addition to viewing graphs as a slide show, you can also export all graphs in the project or in any particular subfolder to a Microsoft PowerPoint file. The order of export can be set using same control used for setting slide show order. Controls are provided for specifying vertical and horizontal offsets and size in units of percentage of page size, for inserting the graph into the PowerPoint slides.
Password Protection and Audit Log
Origin Projects can be protected in version 8.1 using a password. User can also turn on an Audit Log which maintains a log of who saved the Project and at what time. The Audit Log can optionally be protected by a separate password, allowing for a manager to turn on the audit log and check the listing to view activity on the project.
The new features of Password Protection and Audit Log time stamps, combined with Origin's ability to import data from databases using customizable SQL queries saved within the Project, allows for electronic record keeping. These features are important for submitting Origin Projects to Government Agencies that have specific security guidelines such as to the US-FDA which requires 21 CFR Part 11 compliance.
New Graph Types
To complement the existing array of over 60 supported graph types, the following new ones are being introduced in Origin 8.1:
Ternary Contour Plot. This plot utilizes a fourth column of Z values to determine the contours for XYZ ternary data. Customization options include smoothing, and the newly introduced major and minor level contour controls and enhanced support for color palettes.
Weibull Probability Plot. The Weibull probability plot displays percentiles in order to determine if the data could be from a Weibull distribution. Data that are truly Weibull will plot as a straight line on the graph. Origin plots the reference line automatically, based on the Weibull parameters, which you may specify or let Origin estimate from the data.
Windrose Plot. The Windrose plot combines elements of a 2D polar graph with a bar chart, and is very useful for displaying directional data. It is most often used to display variations in wind speed and direction.
New Templates. New graph templates have been added to easily plot multiple datasets in same graph with shared X axis and multiple color-coded Y axes with offsets.
Contour Plot Customization
Enhancements have been made to customization options for contour plots. Users can now set major and minor levels for contours, and optionally only display contour lines at major levels. This allows for a contour plot with smooth color variations, but at the same time not too many contour lines, thus reducing clutter.
Improvements have been made to applying color palettes to contour plots. Once a palette has been assigned, it can be remembered so that changes to the source data will result in reapplication of the same palette. Data (X-Y) corresponding to any or all contour lines can now be extracted to a worksheet.
Data Rearrangement
Data consisting of multiple mixed groups can now be unstacked to separate sets of columns by using one or more columns as group variables. Once grouped data is unstacked, graphing and analysis can be performed with more flexibility.
Data Reduction
Multiple new tools have been introduced for data reduction. These include a tool for deleting rows by skipping, such as deleting every alternate row, and a tool for reducing data with duplicate X values.
The duplicate reduction tool allows for specifying what quantity to use for replacing Y values, such as mean, min, median or sum.
Data Reduction (Pro)
OriginPro provides additional tools for data reduction. These include a tool to reduce data to evenly spaced X values, and a tool to reduce data based on subgroup statistics of X values. Both tools provide multiple methods for deciding how to distribute the reduced data. The tools also provide a preview window of the results.
Signal Decimation (Pro)
This tool provides you with the ability to reduce data by a specified factor, with an optional filter specification. The filter options include moving average or finite impulse response.
Rise and Fall Time Analysis (Pro)
This tool can be utilized to measure rise and fall time of signals. An interactive panel can be used to specify the range of interest on the graph.
Signal Envelopes (Pro)
This tool computes envelope of a signal. Options are provided for computing either upper or lower envelope, or both. A smoothing option is also provided allowing user to specify number of points to be used for smoothing.
Surface Area (Pro)
Surface area can be computed using this tool with data organized in a matrix or in XYZ format in a worksheet.
Custom Menus
The Custom Menu Organizer tool can be used to customize existing menu items by turning selected items off, or to add your own additional main menu items for tailoring the software to meet the specific needs of your end user. Multiple menu configuration files can be created and saved, and shared with other users. Sharing such menu configuration files is supported with the group folder. This feature can be utilized in organizations to provide a custom, consistent interface for all users, or to customize the interface for including the software with instrumentation.
LabTalk Function Support
Support for user-defined functions with multiple parameters has been added to Origin's LabTalk scripting language . Functions can be easily defined and used in script such as from the function plotting interface.
OS : Win XP/2000/Vista/Win 7
===============
==============
================
http://ul.to/vianmt7v/OriginLab OriginPro 8.6 portable.rar
=============
===============
من هنا ستجدون دورة تعليمية فيديوية نافعة جدا
madkour2010
Member
جزاكم الله خيرا
ماالفرق بين النسخة المحمولة والتي عرضها قبل منها مع العلم بان روابط الاولى لاتعمل
تحياتي
النسخة المحمولة لها مميزاتها وهي
1- اصغر حجما
2-لاداعي لاستخدام الكراك معها
3- يمكنك حفظها على الفلاش ميموري واستخدامها على اي حاسب اخر
من دون تثبيتها على الجهاز الاخر اوحتى على جهازك
=========
كيفية التعامل معها: مجرد ان تزيل الضغط عن النسخة بعد تحميلها
قم بنسخها على الفلاش او على القرص الصلب وافتح مجلد البرنامج
وشغل البرنامج من ايقونته التي تشبه صورة واجهة البرنامج
=========
النسخة تعمل بصورة ممتازة ولاتحتوي على اي فايروس
تم التحقق منها
تحياتي لك
عناقيدالضياء
Member
السلام عليكم ورحمة الله
عندما اريد ان احمل البرنامج تفتح صفحة جديدة ولا يوجد اي رابط لتحميل ؟؟
عندما اريد ان احمل البرنامج تفتح صفحة جديدة ولا يوجد اي رابط لتحميل ؟؟
تم تعديل روابط النسخة المحمولةالسلام عليكم ورحمة الله
عندما اريد ان احمل البرنامج تفتح صفحة جديدة ولا يوجد اي رابط لتحميل ؟؟
الاخ علاء العنزي حكيم كتاب العرب والله الكلمات تعجز عن التعبير لك عن الامتنان والشكر بارك الله فيك وابقاك الله لنا ذخرا يا ابو فهد الف شكرالسلام عليكمنقدم في هذا الموضوع شرحا متسلسلا لبرنامج Origin المتخصص برسم وتحليل ومعالجة البيانات المختلفةيعتبر هذا البرنامج احد البرامج العلمية المتخصصة وهو يستخدم على نطاق واسع من قبل العلميين في مجالات عدة والمهندسين في مختلف التخصصات الهندسيةيتميز هذا البرنامج بجوانب عدة تؤهله ليتربع على عرش برامج معالجة الرسوميات وتحليل البيانات المتنوعة , حيث يمتاز هذا البرنامج بسهولة التعامل مع الواجهة التفاعلية لهذا البرنامج كما يتميز بسرعة الاداء وعدم تاثيره على سرعة الحاسبة كما هوالحال بالنسبة لبرنامج الماتلابنوجزبعض المميزات الاساسية لهذا البرنامج1-سهولة ووضوح واجهة البرنامج2- يغطي مدى واسع من عمليات معالجة البيانات احصائيا وتحليليا3-يتميز بتعدد خيارات التحكم بشكل وطبيعة الرسوميات من تحديد نوع المحاور وشكال الخطوط وتقسيمات المحاور والغاء جزء من البيانات قيد الرسم وعدم اظهارها ضمن شكل الرسم النهائي4-تنوع خيارات تعريفات المحاور من رموز وما الى ذلكسهولة استدعاء ملفات البرامج المختلفة مثل ملفات الماتلاب والاكسل وكذلك المنيتابكما يمكنه استدعاء الملفات الصوتية 5- امكانية نسخ الرسوميات الناتجة ووضعها ضمن برنامج الوورد والتحكم بها من خلال الوورد من تعديل وتحسين.....ان الرسوميات الناتجة من برنامج الاورجن يمكنك بسهولة لصقها الى الوورد ومن ثم خزنها هناك....وعند الحاجة الى تعديل على اي رسم ماعليك الى الضغط ضغطة مزدوجة على الرسم فيقتح برنامج الاورجن ضمن برنامج الوورد6-يمكنك استدعاء ملفات الاكسل واجراء العمليات المتنوعة عليها ضمن برنامج الاورجن7- يمكنك اجراء عمليات المطابقة على الرسوميات او ماتدعى ( Fitting) حيث توجد عدة خيارات متنوعة يمكنك اختيار مايلائم بياناتك.....او انشاء صيغة معادلة خاصة بك تطابق النتائج المرسومة لبياناتك عليها8- يمكنك اجراء عمليات متعددة على تحليل الاشارة مثل FFT وما يرتبط بها من FTT Filters9-التعامل مع الصورImage بصورة احترافية...10-التحكم العالي بشكل الرسومات ثنائية البعد والثلاثية البعد والكونتور وارسوميات السطحية بانواع عدة11-يمكنك من دمج عدة رسوم ضمن مخطط رسم واحد12- سهولة التحكم بالبيانات من تحديد قيم الخطا الناتج القياسات العملية=============هذه بعض المميزات التي يتضمنها البرنامج سنحاول تقديم شرح متسلسل له ونكون من الشاكرين لكل من يساهم معنا في وضع شروحات لمجالات يمكن للبرنامج معالجتها....سنعتمد الاصدار origin pro 8.0الموجود ضمن مشاركة اخونا المبدع احمد وهو موجود ضمن المنتدى وما التوفيق الا من عند الله============

 نسخ البرنامج مع الروابطMicrocal Origin Pro 7.0========origin pro 7.5========origin pro 8.0^^^^^^^^^^^^^^^^^^^^^^^^^^^انا انصح بالنسخة origin pro 7.5لانها متكاملة ولاتوجد اي مشاكل بالاصدار وكذلك فهي تحتوي على دورة ملتيميديا حجمها 60 ميكابايتهذه الدورة صوت وصورة ....دورة اكثر من رائعة تبين لك كل خبايا البرنامج...معها لن تكون بحاجة الى اي شروحات اخرى((( مع الوندوز فيستا ....تظهر لك رسالة طلب التسجيل كل مرة ...يمكنك الغائها)))=====الاصدار origin pro 8.0لايختلف كثيرا عن الاصدار origin pro 7.5 الافي جوانب بسيطة منها جودة الرسوم السطحية ورسوم الكونتور حيث انها تكون اجود مع الاصدر origin pro 8.0 الذي يتميز بامكانية عمله على وندوز الفيستا والاكس بي بشكل ممتاز====يوجد اصدار صغير هو origin 5حجمه 6 ميكا يعمل بشكل جيد مع الاكس بي والفستا===%%%%%%%%%%%%%%%%%%%%%%%%%%%%%%%%%%%%%%%%%%%%%%%%%%نبتدا بشرح واجهة البرنامجالدرس الاول ان واجهة البرنامج من السهل التعامل معهافهي واضحة وغير مزدحمة بالرموز والخياراتصورة رقم (1) واجهة البرنامج
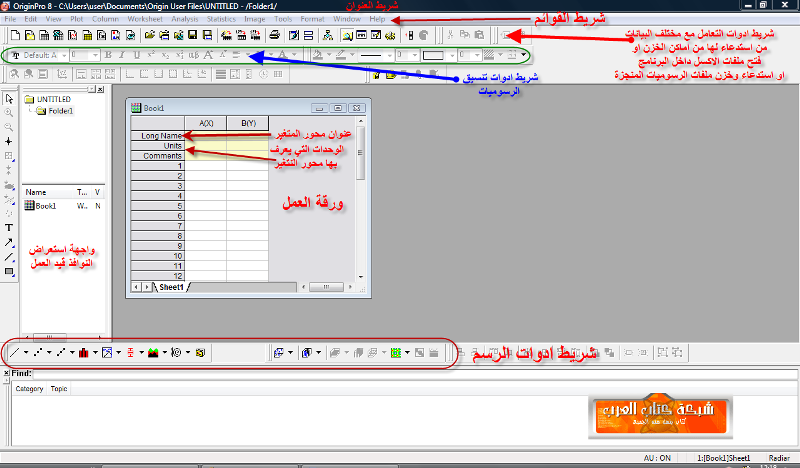 صورة رقم (2) استيراد Import ملف بيانات الى البرنامج
 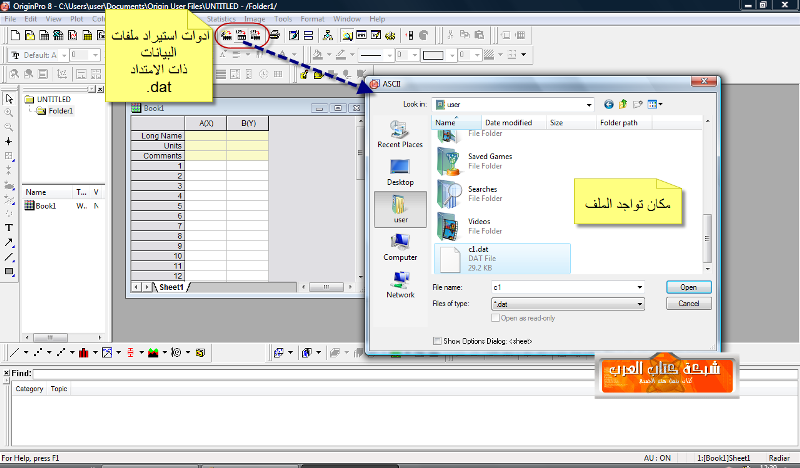 صورة رقم (3) شكل البيانات التي تم استيرادها الى داخل البرنامج
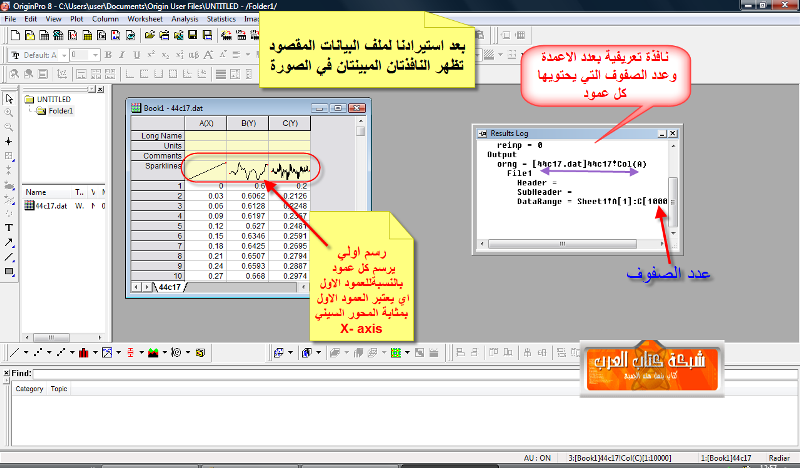
")
OriginLab OriginPro 8.6 SR1 | 385.4 MB
OriginLab produces professional data analysis and graphing software for scientists and engineers. Our products are designed to be easy-to-use, yet have the power and versatility to provide for the most demanding user. Origin is an easy-to-use software application that provides powerful data analysis and publication-quality graphing capabilities tailored to the needs of scientists and engineers. Origin offers unique peak-analysis and curve-fitting capabilities, over 60 customizable graph types, and analysis templates, all within a tightly integrated workbook environment.
Peak Fitting
The Peak Analyzer tool in OriginPro provides the additional capability of finding and fitting multiple peaks in your spectra. Baseline anchor points can be customized and fit with a suitable fitting function, and the baseline fitting can be included as part of the final peak fitting process. A detailed Fit Control dialog is provided to control all aspects of peak fitting including mixed peak functions, peak centers and widths, sharing parameters, and imposing bounds and linear constraints on parameters. Graphical as well as tabular results are generated as part of the final fit report.
Surface Fitting
OriginPro can fit a 3D surface to XYZ data points. The surface and data points can be displayed together, including droplines from the points to the surface.
Statistics
OriginPro expands on the statistical analysis capabilities of Origin by providing additional tools for Descriptive Statistics, Discrete Frequency Counting, Normality Tests, Correlation Analysis, One-way and Two-way Repeated Measures ANOVA, Principal Component Analysis, Hierarchical Cluster and Discriminant Analysis, many Nonparametric Tests such as Friedman ANOVA and Two-Sample Kolmogorov-Smirnov Test and Mann-Whitney Test, Survival Analysis tools including Weibull Fit and Cox Proportional Hazard Model, ROC Curves, and Power and Sample Size Tests.
Signal Processing
Advanced signal processing features in OriginPro include Short-Time FFT (STFT), Hilbert Transform, Coherence, 2D FFT and 2D FFT-based Filtering, 2D Correlation, and Wavelet analysis.
Image Handling
OriginPro offers more ways to handle your image data, including alpha blending, pixel logic, morphological filtering, and interpolated background subtraction.
Analytical Power
With so much analytical power, OriginPro is the software of choice for those who want a single data analysis and graphing solution.
Home Page - http://www.originlab.com/index.aspx?go=PRODUCTS/OriginPro
==========
============